gmtxy-image : 2D grid data image mapping using shell script and GMT5 under the Cartesian coordinates.
Installation
gmtxy-image is a shell script that plots a 2D grid data under the Cartesian coordinates using GMT5. To use it, simply copy the shell scripts dispOption.sh and gmtxy-image.sh into any directory you want, and symlink them to a directory that is included in your $PATH, then reopen the terminal.
Setup
Please go to the end of gmtsph-regional.sh, where you will see lines as
imgcat $jpgfile #open the output file in terminal, this requires the iTerm.app and imgcat.sh
open $jpgfile #'open' is a command in-build within MacOS
Please use either of them as you see fit. Or for Ubuntu users, you may want to use the command see. I don’t know the corresponding command for other Linux distributions. But you see the gist here.
Usage
gmtxy-image.sh -i<grid-data> [-r<xmin>/<xmax>/<ymin>/<ymax>] [-u<unit>] [-c<cpt-file>] [-a<x-label>,<y-label>] [-g] [-h]
Options
The only argument you need to input is name of the grid file to get a glance of the file. To get a better look, the following options need to be set.
- -i: Name of the input grid file. Perfectly, you should use a .nc file. However, Surfer’s griding format is also supported since the GMT5.
- -r: Data range of the input grid file. The script will use the whole data range by default. The use of this option will force a customized range for plotting.
- -u: Unit of the input data. A special case is that if you want to annotate the color bar with ‘km’ while the unit of the input data is in meter. Then please set the argument of this option as ‘km+Uk’ to turn on the feature.
- -c: input cpt file used for generating a data specified cpt file. The GMT command ‘grd2cpt’ is used by default.
- -a: Axis’s labels separated by semicolons.
- -g: Draw an extra layer of shaded topography to get a 3D texture of the output image. The default will be the input grid data.
- -h: Show help information.
Example
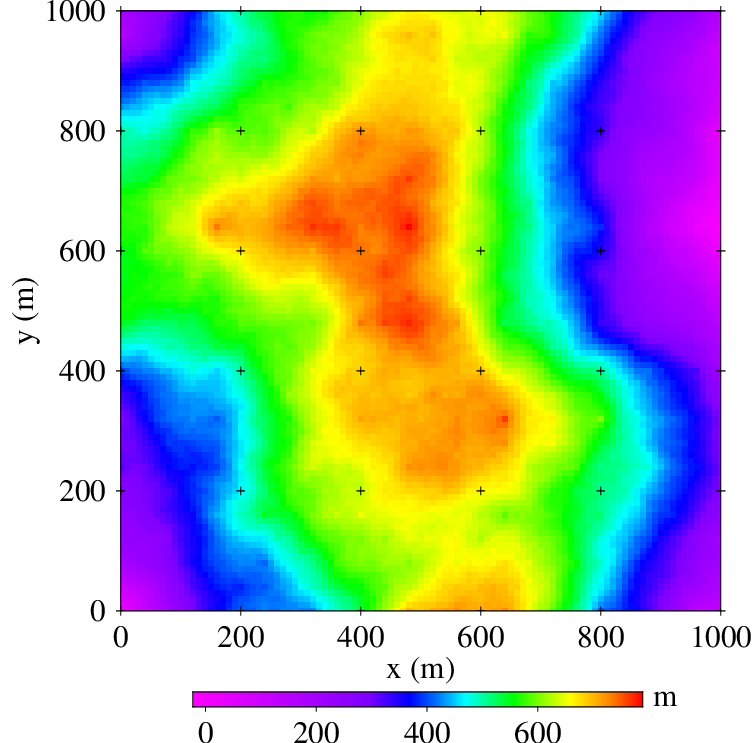
The following is used to draw the example.nc. Names of the output files are taken from the input grid file. Moreover, the script will output a png (no background) and a eps file.
gmtxy-image -i exmaple.nc
The output should be as below.