gmtsph-profile : Vertical section mapping using the polar coordinates.
Installation
gmtsph-profile is a shell script that plots a 2D grid data using the polar coordinates using GMT5. To use it, simply copy the shell scripts dispOption.sh and gmtsph-profile.sh into any directory you want, and symlink them to a directory that is included in your $PATH, then reopen the terminal.
Setup
Please go to the end of gmtsph-profile.sh, where you will see lines as
imgcat $jpgfile #open the output file in terminal, this requires the iTerm.app and imgcat.sh
open $jpgfile #'open' is a command in-build within MacOS
Please use either of them as you see fit. Or for Ubuntu users, you may want to use the command see. I don’t know the corresponding command for other Linux distributions. But you see the gist here.
Usage
gmtsph-profile -i<grid-data> [-r<start-deg>/<end-deg>/<r>/<R>] [-u<unit>] [-c<cpt-file>] [-a<x-label>;<y-label>] [-f<offset>] [-h]
Options
The only argument you need to input is name of the grid file to get a glance of the file. To get a better look, the following options need to be set.
- -i: Name of the input grid file. Perfectly, you should use a .nc file. However, Surfer’s griding format is also supported since the GMT5.
- -r: Data range of the input grid file. The script will use the whole data range by default. The use of this option will force a customized range for plotting.
- -u: Unit of the input data.
- -c: input cpt file used for generating a data specified cpt file. The GMT command ‘grd2cpt’ is used by default.
- -a: Axis’s labels separated by semicolons.
- -f: Offset angle of the profile. the default will use mean value of the x-range. This will put the averaged x value in the center of the plotting.
- -h: Show help information.
Example
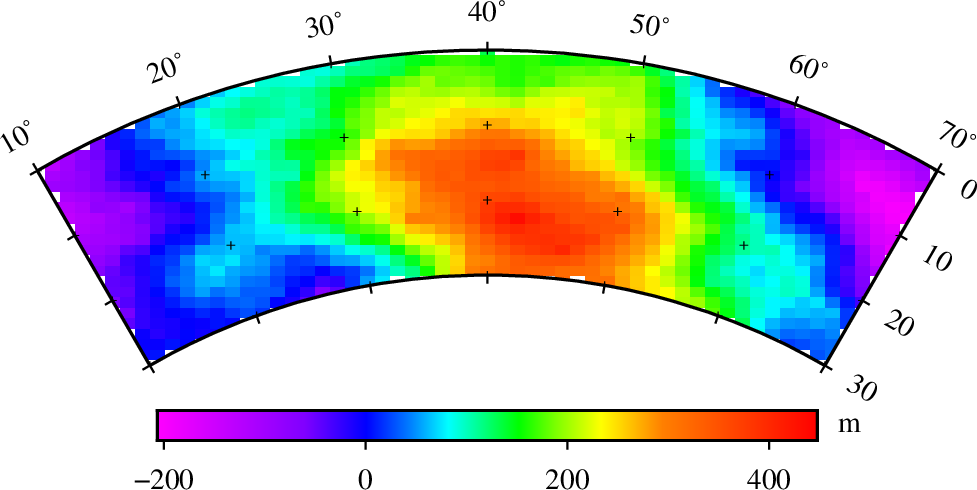
The following is used to draw the example.nc. Names of the output files are taken from the input grid file. Moreover, the script will output a png (no background) and a eps file.
gmtsph-profile -i exmaple.nc
The output should be as below.
